By Sarah Jefferies
This survey was designed to gain insight on various topics from those who live in Waterloo Region. Several academic researchers, Union Sustainable Development Co-operative, and Scaled Purpose have partnered on this project to learn more about region-wide opinions on different topics and will use this data for research in the future. The questions in the survey explored the respondent’s opinions on COVID-19, politics, investing, and affordable housing, just to name a few. A total of 101 individuals completed the survey, thus the results should not be generalized to a population but instead used to demonstrate some areas that warrant further study.
Results
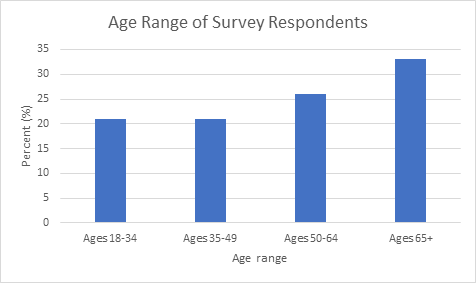
Although there were many topics covered in this survey, there are a few worth highlighting. One of the first questions asked was their age, which was then categorized into age ranges to present the data. The results show that respondents’ age who participated in this survey are heavily weighted in the categories of 50-64 years old and 65+ years old.
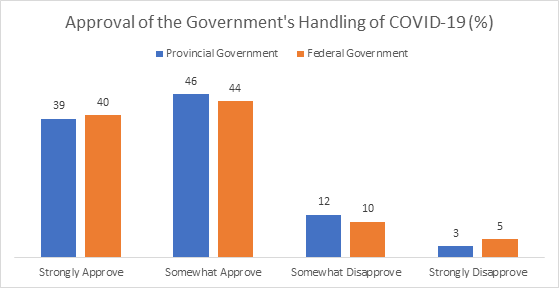
The participants to this survey show that they approve of how well both the federal government and provincial government is handling the COVID-19 pandemic. Results show that 39% strongly approve and 46% somewhat approve of how Premier Doug Ford is handing the COVID-19 situation, with only 12% somewhat disapproving and 3% strongly disapproving of the handling of the current situation. Similar results are shown with the approval of how well Prime Minister Justin Trudeau is handling the COVID-19 Pandemic. 40% strongly approve and 44% somewhat approve of his handling of the situation, where only 10% somewhat disapprove and 5% strongly disapprove of his action during the pandemic.
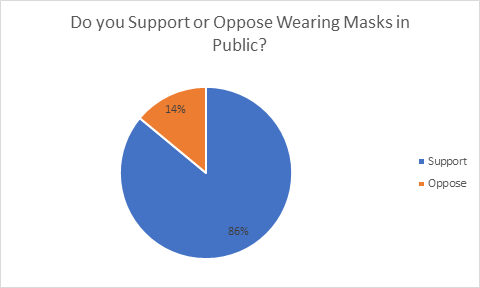
With the recent mandate of mandatory masks in Waterloo Region, it is promising to see that 86% of the surveyors approve of this practice to help reduce transmission of COVID-19. With only 14% opposing this practice, these efforts will continue to help reduce the cases of contracting COVID-19 in the future.
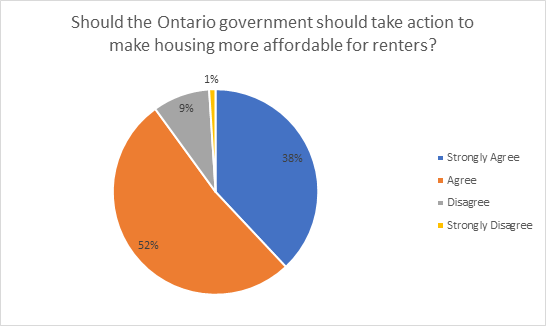
Another important topic worth highlighting is around opinions on affordable housing, both on a regional and provincial level. Most participants agree that the Ontario government should take action in making housing more affordable for renters. This strong consensus in favour of affordable housing will hopefully translate into support for Union Sustainable Development’s planned Community Land Trust in efforts of developing affordable opportunity development co-operatives in Waterloo Region. Union Sustainable Development Co-operative buys and manages multi-unit residential and commercial properties for the environmental, social, and economic benefit of Waterloo Region.
Conclusion
This live-caller survey offers many insights into the perspectives of those who live in Waterloo Region. Although there was a lack of variety in age ranges, these results can show some insight on Waterloo Region opinions on these important topics. In the future, it will be interesting to see if different age groups would slightly change the results of this survey.
It will be interesting to see if those perspectives change over the next year especially since 2020 has been a historic year in which the world and the Region of Waterloo have witnessed a pandemic. Topics such as wearing masks had no bearing on people’s lives last year but will now continue to be an ongoing conversation.
The survey contained many other questions if you would like to see the detailed results please visit https://doi.org/10.3886/E120552V1