In January 2020 ThreeHundredThirtyEight.com introduced a new blog series featuring content written by Conestoga College Public Service Program students.
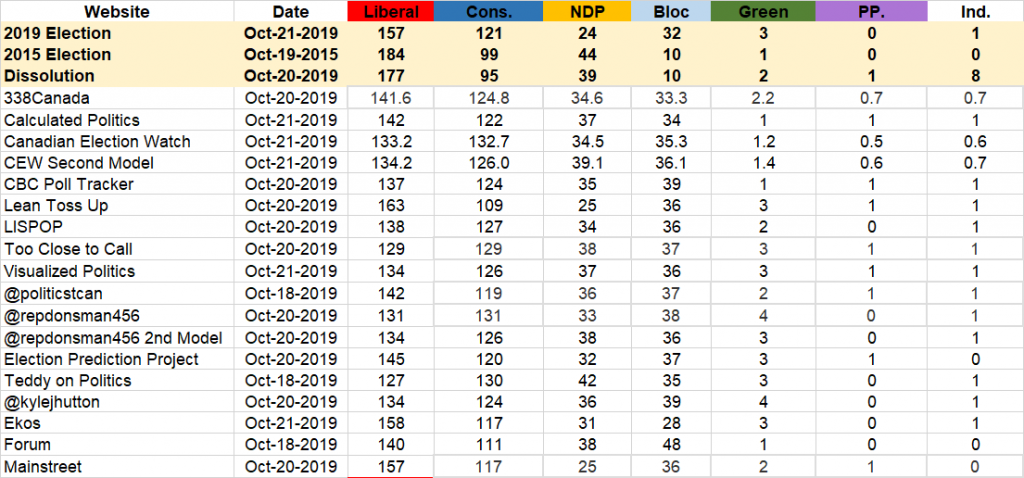
With the votes mostly counted and almost all seats decided, it is now possible to evaluate the election projections and predictions. For this analysis, I have used data from the CBC Canada Votes at 11:00 am on October 22, 2019.
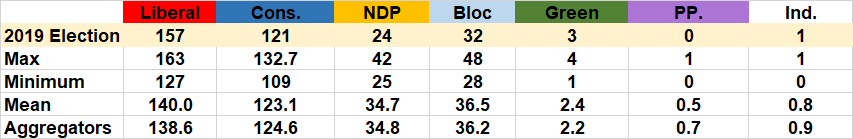
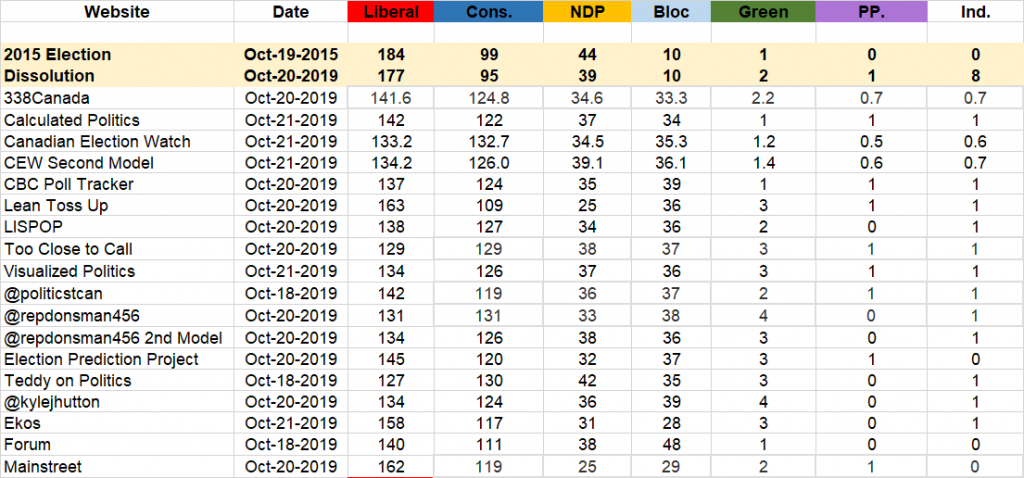
Liberals won 157 seats. Overall, we can see that all the poll
aggregators except for Lean Toss Up underestimated support for the Liberals. All
the analysis-based projections also underestimated the Liberal support.
However, two of three polling firms Ekos and Mainstreet overestimated support
for the Liberals. Ekos was the closest to the Liberal projections missing by
one seat at 158.
The Conservatives won 121 seats. Every poll aggregator
projection, except for Lean Toss Up and @politicstacan, overestimated support
for the Conservatives. All three polling firms underestimated Conservative
support. Calculated Politics was the closest Conservative projection missing by
one seat at 122.
The NDP won 24 seats. Every projection overestimated NDP
support. Lean Toss Up and Mainstreet were the closest to the NDP at 25. The
Bloc won 32 seats and every projection except for Ekos and Mainstreet estimated
Bloc support. Calculated politics were closest to the Bloc at 34.
The Green party won three seats. Seven projections accurately
projected this result. The People’s Party of Canada won zero seats. Seven
projections accurately projected this result as well. One independent won,
fifteen projections predicted this result.
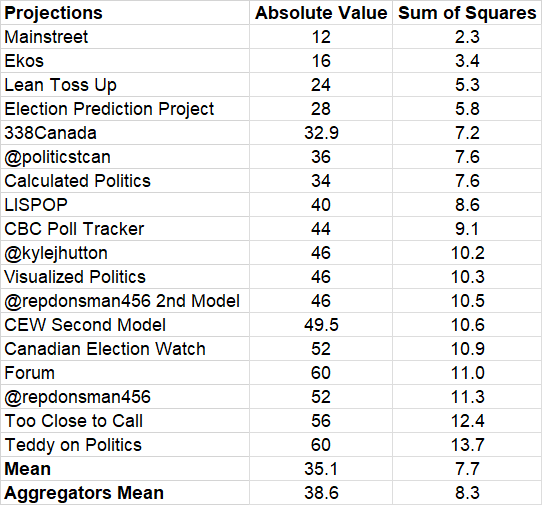
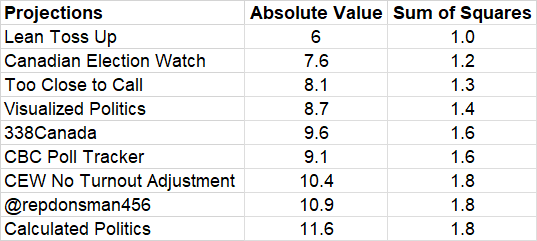
To evaluate the overall accuracy of the different projections two methods are being used. First, the projection for each party is subtracted from the actual seats won. The absolute value is then taken (i.e. if it is negative it is turned positive) and these values are added together. The second method involves taking the Sum of Squares difference. This is done by subtracting the difference between projection and result and squaring this value then adding these together. This value is then divided by 7 (for the 7 projections) and then the square root is taken to show the average difference between each individual projection. The results of the two approaches are relatively similar.
Mainstreet was the most accurate projection by polling firm
with Ekos close behind. Lean Toss Up was the most accurate poll aggregator, and
third most accurate. The Elections Prediction Project was the most accurate analysis-based
projection and fourth overall.
Part of the accuracy is determined as a result of the models
the polling firms and aggregators use to project the election. Some of the
differences in accuracy can also be attributed to how the polling aggregators model
the polls of the election.
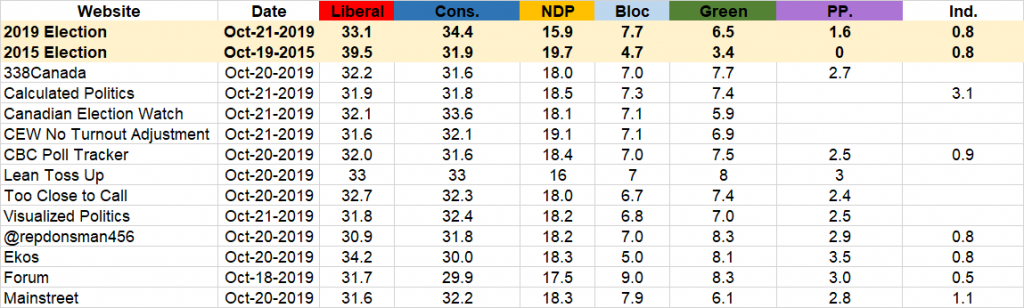
When comparing how the poll aggregators did at projecting
the election Lean Toss Up once again was the most accurate only missing the
actual results by an average of one percentage point. It should be noted that some
of the poll aggregators did not share the projections for the PPC of Independents.
While individual models varied slightly in their performance. Overall, the aggregators, analysis-based projections, and polling firms should be satisfied with how they performed at projecting this election. All models predicted a minority government and most projected the Liberals would win the most seats.
*Updated at 1:00 pm to include the final Mainstreet seat projections
Election day has arrived, the polling firms have completed their polling, the projection sites have projected, and all that is left is to count the votes. On October 15, 2019, ThreeHundredThirtyEight.com summarized the election projections. Today we are updating those projections with the latest numbers. After the election, we will report on how well the projections did at predicting the actual election results.
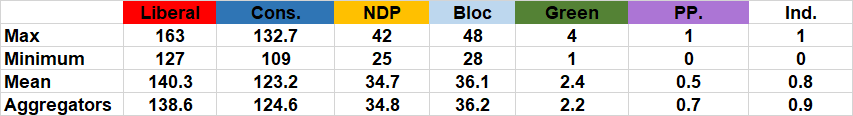
A glance at the projections shows the Liberals will likely lose significant support from the 2015 election. The Conservatives and the Bloc appear to be the most likely to gain from these losses. The NDP will likely lose some support. The Greens seem likely to hold the two seats they held at dissolution and may gain a few seats. The People’s Party of Canada is projected to have one or zero seats. The projections also predicted most independents will lose their seat. Note, at dissolution, the CCF held one seat and five seats were vacant. These are not listed in the table above.
The table above provides a snapshot of the polling results. The first row shows the highest total any projection places a party and the next row the lowest. The average of all projections is listed next. The final row shows the average of the polling aggregators. It’s worth noting that some of the aggregators provide ranges around their projections, which indicate that a large variety of outcomes are possible in an election like this one where the polling data is so close. Please check the linked website above if you are interested in seeing all the range of potential election outcomes.
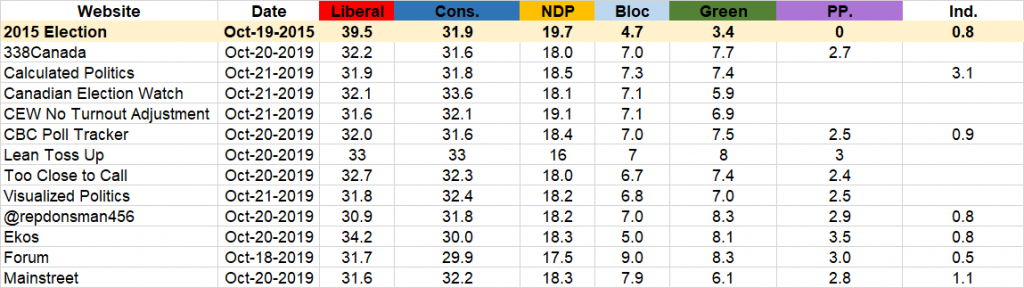
The various projections models in Canada, with the exception of the Election Prediction Project, all use some sort of variation on a regional swing model to predict the election results. Essentially this model uses the previous election results and compares it to the polling data in the current election. So, for example, in a basic swing model if in Saskatchewan a party got 10% of the vote last election and polls now have them at 20%, the projected vote total in every riding for the party would be doubled. If another party went from 30% to 20% the projected vote total for that party would drop by one third in every riding. The website ThreeHundredThirtyEight.com, which was run by Éric Grenier before he went to CBC provides a good explanation of the model he used in 2011.
Some variations in results are generally a result of variations of how the regional swing model is applied. For example, some models provide bonuses for incumbents, whereas others incorporate riding polls. How the polls are aggregated can lead to variation as well. Forum and Mainstreet make projections using their own polls only. The poll aggregators can use different methods to average the polls. Canadian Election Watch, for example, attempts to predict turnout as part of its aggregation of the polling data. Support totals are manipulated to increase Conservatives +1.5% and Liberals +0.5% and decrease the NDP -1% and Green -1%. The table above shows that while the different methods yield relatively consistent comparisons there are subtle differences. The Liberals, for example, vary between 31% to 33% when examining the aggregators. Note, not all poll aggregators publish their aggregated totals.
If you would like to make your own projection, please feel free to post it in the comments below or post it in the Google Sheet. Share the seat total for Liberal / Conservative / NDP / Bloc / Green / PPC / Independents and what you project as the turnout for the election. In a future blog post, we plan o evaluate the predictions.
*Note projections will be updated as they are made throughout the day. Projections in Italics are not believed to be the final projections of the aggregator.