By Onomo Ogbe
The results of this poll were based on an interactive voice response survey conducted on Wednesday, July 15th, 2020 from 10:00 am to 8:00 pm. A total of 1306 individuals completed the first question of the survey and 633 individuals completed the entire survey.
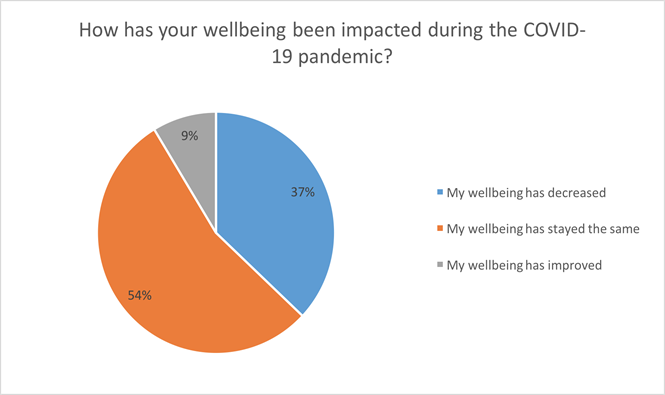
The survey was designed to provide information to the Region of Waterloo in order to review the priorities in the 2019-2023 Strategic Plan. The first question respondents were asked was about how their wellbeing has been impacted during the COVID-19 pandemic. The results show that most respondent’s (54%) wellbeing during the COVID-19 pandemic has stayed the same. The pie chart below represents the results.
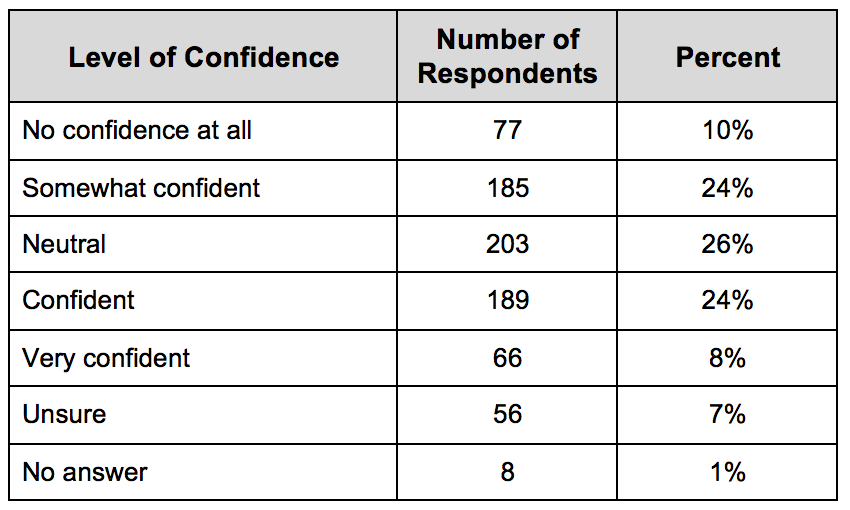
On the survey, participants were asked about the level of confidence they have in their local government. The results are shown in the chart below, indicating that a majority of citizens (59%) are confident in the regional government to some degree (including somewhat confident, confident, and very confident levels).
| Confidence level | 2020 Region of Waterloo Survey |
| No confidence at all | 12% |
| Somewhat confident | 23% |
| Neutral | 24% |
| Confident | 29% |
| Very confident | 7% |
| Unsure | 5% |
The poll surveyed region-wide opinions on the quality of life in Waterloo region since the beginning of COVID-19 pandemic. According to the results, most respondents (49%) stated that their quality of life has declined in Waterloo region since the beginning of the COVID-19 pandemic.
Comparing the above result to the 2019 Region of Waterloo Survey where respondents were asked how their quality of life in Waterloo Region has been over the past few years, we can see that since the start of the COVID-19 pandemic quality of life in Waterloo Region has declined. The chart below compares the results from 2019 and 2020 Region of Waterloo Surveys.
| Quality of life | 2019 Survey | 2020 Survey |
| Improved | 34% | 11% |
| Stayed the same | 40% | 33% |
| Declined | 26% | 55% |
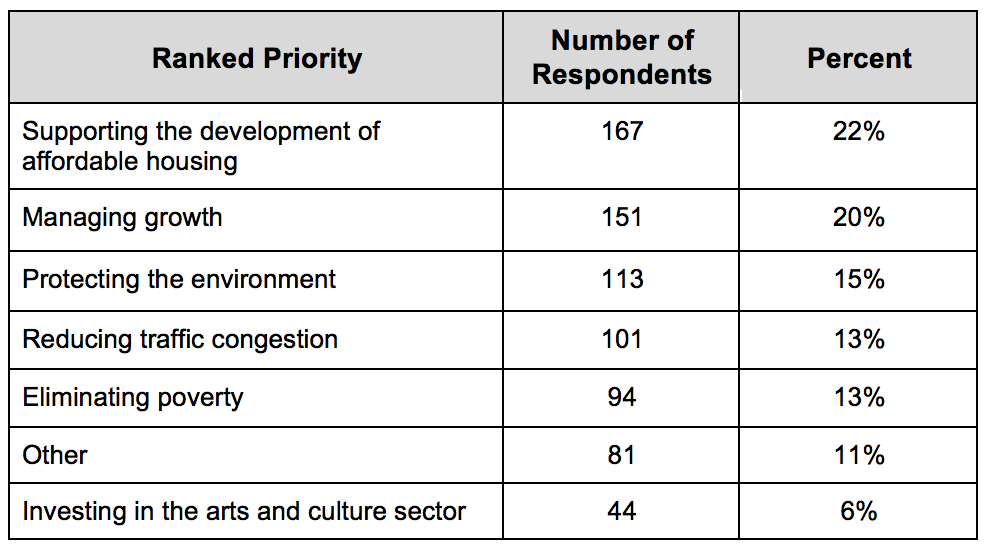
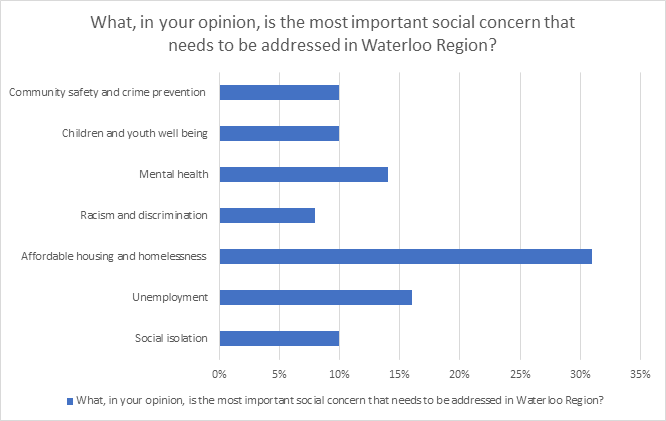
The survey was a way to identify the top priorities to inform the review of their 2019 – 2023 Strategic Plan. Respondents were asked what they think is the most important social concern that the regional government should address. The results, as shown in the chart below, have been ranked based on the number of respondents choosing a given category as their top priority. The top 3 priorities are 1) affordable housing and homelessness, 2) unemployment, and 3) mental health. The bar chart below represents the priorities of respondents.
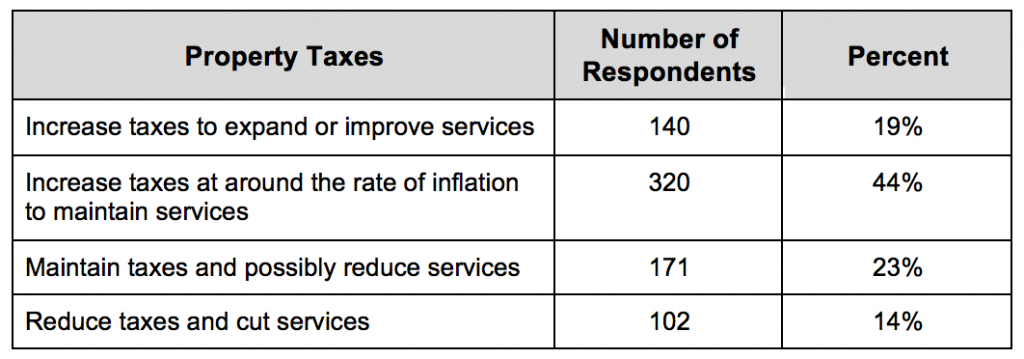
A significant component of the Strategic Plan focuses on the services that are delivered by the Region of Waterloo, such as public transportation, waste collection, and so forth. In order to better understand the preferences among citizens living in the Waterloo region in relation to payment for the delivery of services, the survey asked: “Regional Government must balance the cost of delivering services with taxation. Which of the following would you most prefer for property taxes in Waterloo Region?”
Results indicated that 21% preferred increasing taxes to improve services while 16% preferred having property taxes decreased. 17% preferred keeping taxes the same and possibly reducing services. The largest proportion (46%) preferred having taxes increased with the rate of inflation and maintaining current services.
Comparing this result to the 2019 Region of Waterloo Survey we can conclude that there has been a slight change over the year. The chart below compares the result between the 2019 and 2020 Region of Waterloo Survey.
| Preference for property taxes | 2019 Survey | 2020 Survey |
| Increase taxes to expand or improve services | 19% | 21% |
| Increase taxes at around the rate of inflation to maintain services | 44% | 46% |
| Maintain taxes and possibly reduce services | 23% | 17% |
| Reduce taxes and cut services | 14% | 16% |
Ultimately, the survey helped to provide the Region of Waterloo with important information that can be used to review the 2019-2023 Strategic Plan. A total of 14 questions were administered, yet the responses that have been analyzed above highlight the most critical results that will be taken into consideration by the Region.
…
Survey Details
This survey was an Interactive Voice Response (IVR) survey which was conducted by Dr. Anthony Piscitelli with the help of Public Service co-op students at Conestoga College.
Sampling Approach
The sample used for this study was created by randomly selecting Waterloo Region landline phone numbers as listed in a digital phone book. As well, a sample of likely cellphone numbers was added by randomly selecting phone numbers that were originally assigned to Waterloo Region according to the Canadian Numbering Administrator. Phone numbers of businesses were filtered out of the randomly selected phone numbers.
Response rate
A total of 1306 individuals completed the first question of the survey and 633 individuals completed the entire survey. The first question response rate was 4.2%, with the full survey response rate being 0.6%. There was a large drop off between questions 1, 2, and 3, due to the fact that 11% of respondents were ineligible due to being under 18 or living outside of Waterloo Region.
Weights
Results of this survey have been weighted by age, gender, and city/township according to the 2016 census. The full weights are posted along with the raw data on OpenIcpsr.org and can be found by visiting: https://doi.org/10.3886/E120453V1
Margin of Error
Results are considered accurate +/-3.9%, 19 times out of 20. The margin of error on subsamples is higher.
Raw Data
Raw survey data is available on OpenIcpsr.org. The data can be found at https://doi.org/10.3886/E120453V1
Disclaimer
This survey was approved by the Conestoga College Research Ethics Board. Sampling error exists due to the mismatch that is created by the random dialing of phone numbers as opposed to randomly sampling actual Waterloo Region residents.