Menu Close

The Narrative of the 2018 Ontario Election: Introduction

By Suhani Singh

The June 7, 2018 Ontario General Election saw the Progressive Conservative Party defeat the Liberal Party to take power. The election was historic in many ways including a greater voter turn out than previous years and the Liberal Party losing its official party status by a mere one seat. The opinion polls conducted before and during the campaign period allowed Ontario voters to get a sense of what was occuring during this time and predicted the election outcomes rather accurately.

This blog series will consist of four blogs analyzing how the polls compare to the actual election results and how each party performed amongst different demographics. Polling data from March 11 to June 6 was collected from polling firms reported in Wikipedia during the precampaign and campaign period to create scatter graphs for better visualization.

This first blog will examine the overall trends in polling and explain the methodology used. The subsequent three blogs will explore how the parties performed by age group, gender, and region in the polls, noting any trends or similarities to the election results.

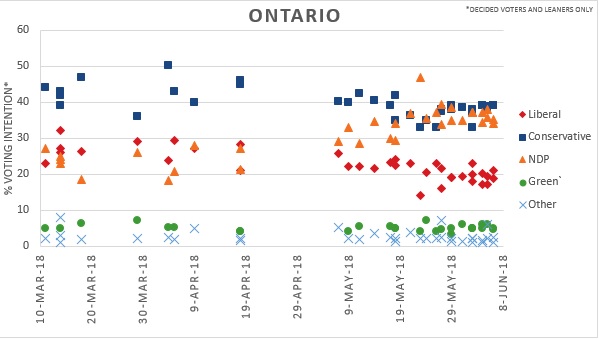
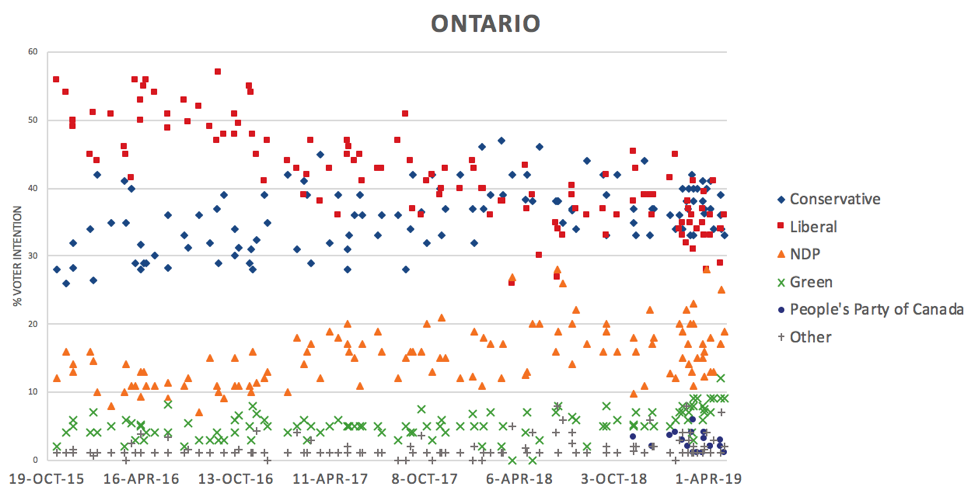
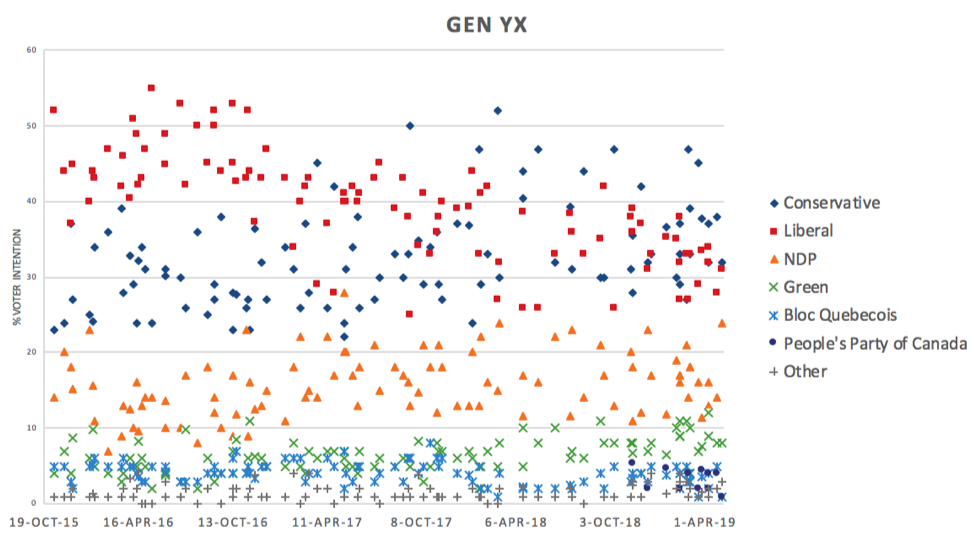
The graph above gives a snapshot of public opinion and voting intentions for all of Ontario during pre-campaign and campaign period for the 2018 Ontario General Election campaign period. The Conservatives had relatively stable support during the pre-campaign period polling over 40% in some polls, falling only slightly during the campaign period between 30% – 40%. This may be an example of the Conservatives peaking too early, though it did not cost them a majority government. 

As the campaign period approached, support for NDP saw an increase from 20% – 30% to approximately 25% – 35%, almost reaching 40% throughout late May and early June. The turning point for the NDP and the election overall began when the leaders had their first debate on May 7, 2018 where voters saw that they had another option. From this point onwards, a rise in NDP support is clearly visible.

Support for Liberal Party took a more significant dip in the polls. Starting off with nearly 25% support in the precampaign period in March and April, the Liberals fell below 20% closer to the election, putting them significantly below the Conservatives and NDP. As a result of declining support numbers, the Liberals lost the election, ending their 15 years of power in Ontario.

Methodology

A quick note on methodology, to compile the data for this graph and the other graphs in the blogs in this series, we collected polling data from March 11, 2018 (Doug Ford’s appointment as the leader of progressive Conservative Party) to June 6, 2019 (last day before the June 7thelection) that was reported in Wikipediaand CBC Poll Tracker. We looked at the polls which asked Ontarians about their voting intentions for the upcoming election and recorded data from the leaning and decided sample groups in each poll. The polling firms used included Forum Research, Abacus Data, Mainstreet Research, Ekos, Ipsos, Leger, Pollara and Campaign Research. We ommitted data from polling firms that asked the voter intentions question in a way that was not similar to other polling organization (mainly Nanos Research who asked for top two choices) and those that did not have detailed tables about decided and leaning voters. The support average for all of Ontario as analyzed in this blog includes a greater number of polls than other demographic groups as not all organizations broke down the polling data by demographics.

As previously mentioned this blog series will talk about different voting preferences among age groups, genders and regions.  In the first follow up blog, the different voting preferences among males and females will be explored to see how they changed overtime. 

Changing Voter Trends Across Canada: Conservatives Overtaking Liberals in Support Numbers in Almost all Regions

By Natalie Pikulski

The first blog in this series examined federal public opinion polls about voter support from November 7, 2015 to May 4, 2019. The next two blogs examined voter support by gender and by age groups. This fourth and final blog will look at regional differences and similarities in terms of voting trends and what it could mean for the upcoming election. 

In Atlantic Canada, the Liberal party saw high voter support during the 2015 election and throughout the post-election year polling significantly over 50%, even reaching above 70% support in some polls. This high starting point for the Liberals paired with lower support for the Conservatives in 2016 meant that the trend of party overlap and gap closure is only occurring in early 2019. Both parties are polling around 40% making the drop in Liberal party support in this region the highest in Canada. 

Ontario shows similar trends to the national average where Liberal support remained high (around 50%) for the first year after the election which eventually began to slip while the Conservatives saw a decreasing range from 15-35% in 2016 to 20-35% by early 2017. The two parties saw an eventual overlap starting in late 2017 at 35% – 45%. As of 2019, both parties declined in support, but the overlap is still strong at 30% – 40%, too close to claim a lead just yet. 

The trends seen nationally, in Atlantic Canada, and Ontario are also noticeable in British Columbia. An overlap between the Liberals and Conservatives began in late 2017 with both parties at 25% – 40% support. This continued for about a year until early 2019 when Liberal support dropped to 25% – 35% while Conservatives stayed within the same range with a few outlier polls, putting them in a slight lead as of May 2019. One thing to note about British Columbia is the considerable amount of support for the Green Party at 10% – 20% which is approaching support levels similar to the NDP which stand at 15% – 25%.  

In Alberta, Conservative support has typically been much higher than elsewhere in Canada. Other regions had Liberals polling significantly higher than Conservatives right after the 2015 election, it was quite the opposite in Alberta. Liberals polled as low as 20 – 40% in the post-election year while Conservatives were between 50% – 60%. However, the trend of falling Liberal and rising Conservative support can still be noticed in the province with Liberals slipping to 15% – 25% and the conservatives reaching 60% – 70% support in 2019. The gap between the two parties is unlike any other region as there was never an overlap and the trend indicates a gap expansion, not a closure. 

The Prairies region has a similar trend to Alberta where the support gap is opening, however, the difference between Alberta and the Prairies is the starting point of the two parties. After the election, Liberal and Conservative support largely overlapped for most of 2016 at around 30% – 50%. Alberta’s gap was much larger than the Prairies but the trend of significant Conservative growth and Liberal decline that opened the support gap is still visible.

Voter intention in Quebec has generally followed the same falling Liberal and rising Conservative support trends but unlike other regions (apart from Alberta) the gap in voter intentions has not fully closed or overlapped at any point. Other regions have been seeing Conservatives pulling slightly ahead or overlapping significantly with the Liberals. In Quebec, the Liberals have maintained a higher level of support (25% – 40%) over the Conservatives (20% – 30%) in 2019. 

Liberal support in terms of vote intention percentages is similar to the national average and other regions like Ontario, BC, and Atlantic Canada but what allows them to be ahead in the polls is the considerably lower level of support for the Conservatives. While the trend of falling Liberal and rising Conservative support is still seen, the Conservatives have not managed to reach the level of support needed to meet or pull ahead of the Liberals at this moment in time. 

The BQ polled similar to the Conservative party (10% – 20%) since the election until mid-2018 where the Conservatives saw a slight increase to 20% – 30% that carried them to early 2019. Conservatives continue to poll slightly above the BQ, even with the sudden 2019 BQ increase that puts them at 15-25% support. This larger split in votes and slow growth of the Conservatives could explain why Liberals are still polling higher but this reasoning should get taken caution as there are many potential explanations that are not mentioned here.

Over the last four blogs, common voter intention trends could be seen in almost all demographic groups across Canada. Similar trends seen include: falling Liberal support that was consistently high in the first post-election year, significantly dropped early 2017, and continued to decline; rising Conservative support since the last election seeing them beat out Liberals in support numbers in most demographic groups; stable NDP and BQ; and a slight rise in the Green Party in 2019. These trends found in the polls will be something to look for during the fall 2019 election to see where they lead.

Changing Voter Trends Across Canada: Age Demographics

By Natalie Pikulski

This blog series aims to analyze federal voting intentions of different demographic groups and compare how they fit or deviate from the national average. The first blog introduced the national trends and the second blog looked at trends among male and female voters. This blog will look specifically at age groups broken down by generation to see if the trends found in the previous demographic groups can be observed. 

There was no consistency in age group breakdowns among polling organizations. Therefore, we created the following generation groups with the adjustments described in the table below. 

Some firms had much larger age ranges than described above which would have skewed the results. We removed Ipsos age groups 34-54 and 55+ when creating the scatter plots as these year differences spanned more than one generation.  

Among Gen ZY voters, the Liberal party was polling between 40% – 55% percent throughout 2016 while the Conservatives stayed around 20% – 30%. Considering that the parties began to overlap in some polls in mid-2018 at 25% – 40%, this was a significant fall for the Liberals and a substantial gain for the Conservatives which led to a tighter overlap in the two parties in 2019 with fewer outlier polls. The current overlap remains in mid-2019 but it appears Liberals are still slipping slightly, giving room for other parties to gain support.

The NDP has been steadily increasing over the past four years among Gen ZY voters, polling between 15% – 30% in 2019, close to Conservative and Liberal levels. The Green Party polled much higher as well, reaching as high as 15% support in 2019.  Compared to the national average, the falling trend in Liberal support is very similar but the Conservatives are polling much lower in Gen ZY while the NDP and Green are much higher. 

The gap between the two top parties observed in Gen YX was smaller than in Gen ZY as the Conservatives initially polled higher and at a larger range (25%-40%) after the election up until early 2018. Liberal support was similar to the previous generation sitting at 40% – 55% for the post-election year and falling to 35%-45% in early 2017. Liberals began to overlap with the Conservatives until early 2019 where the Conservatives rose above to 30% – 40% while the Liberals fell to 25% – 35%. The NDP and Green party has stayed almost stable with a slight increase. The general trends in this age group are similar to the national averages.

Gen X had results very similar to Gen XY having almost the same support percentage levels in terms of where the top two parties started after the election and began overlapping, the eventual Liberal downfall and Conservative rise in 2019, and stable NDP support falling between 10% – 20%. The general national trends can once again be observed in this age group but not as pronounced due to a much smaller sample size that was also the case in Gen XY.

The gap between the Liberals and Conservatives in Young Boomers was quite significant and remained rather stable with the Liberals at 45% – 55% and Conservatives at 25% – 35%. This lasted until late 2016 where the Liberals rapidly declined to 35% – 45% support and the Conservatives rose to 30% – 40%. This support stayed rather stable for 2017 and 2018 with a slight overlap in some polls. The continuous slow rise of the Conservatives put the party ahead with 35% – 45% support in 2019 while Liberals had a sharp decline to 30% – 35%, likely due to the SNC-Lavalin scandal.  

Apart from the two main parties, national trends are not really seen in Young Boomers as the NDP and Green Party are significantly lower in this demographic. The BQ also appears slightly higher compared to the national average and other age groups. 

The Boomer age group had similar trends to Young Boomers with a distinct but smaller gap between Liberals (45% – 55%) and Conservatives (above 30%) in the first year, followed by a 2017-2018 overlap at 35%-45%. Unlike Young Boomers and the national average, the 2019 polls show less of a post SNC-Lavalin scandal Liberal drop, staying stable at 30% – 40%. However, it appears that Conservatives are still slightly ahead in the polls at 35% – 45% in early 2019. 

Compared nationally, the trend is very similar but the initial Liberal and Conservative gap in 2016 was tighter so the overlap occurred much sooner. Similar to Young Boomers, NDP and Green support is very low and appears to be significantly below the national average. 

Moving into the election, it will be interesting to see how the different age groups change and if any parallels will be observed once again. Seeing the same trends over the last few demographic groups explored in the last three blogs will guide us into the fourth and final blog exploring different regions in Canada to see if these similar trends can also be observed.