
By Natalie Pikulski
The first blog in this four-part series looked at federal polling data from November 7, 2015 to May 4, 2019 to find trends among decided and leaning voters at the national level. This second blog will look at how male and female demographics compare against each other and how they align or deviate from the national average discussed in the previous blog.
Overall, the polls show a much smaller gap between Conservative and Liberal support in males when compared to females and the national average.
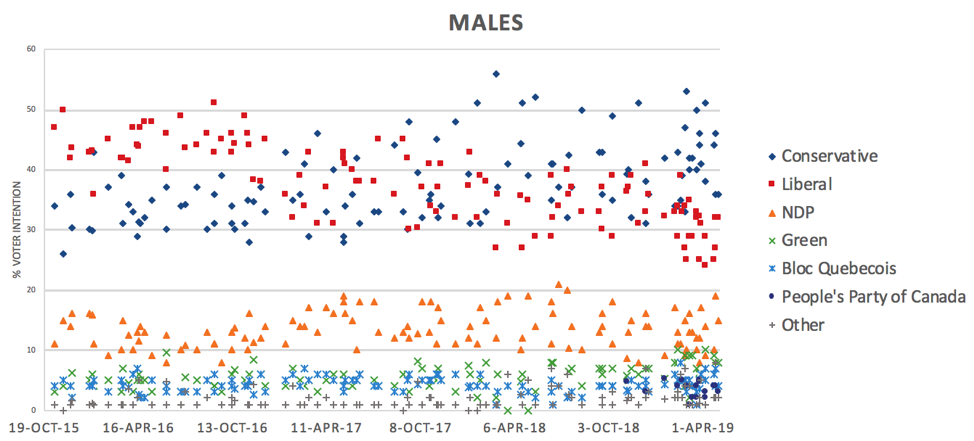
Male support for the Liberal party was around 40% – 50%, slightly ahead of the Conservative party which polled between 30% – 40% since the election until early 2017. At this time, an overlap in party support became much more evident with both parties polling at 30% – 45%. This created a neck and neck race with no clear indication of where most of the voter support was until early 2018 which saw the Conservatives begin to pull ahead of the Liberal party that was on the decline. As of early 2019, the Conservatives appear to be clearly ahead of the Liberals in the polls among the decided and leaning male population, pulling about 40% – 50% support while Liberals are down to about 25% – 35%.
Support for other third parties like the NDP (10-20%), Green (5-10%), and BQ (5%) remained rather consistent with male voters not showing any significant spikes or increases in support apart from the small growth in Green Party that consistently puts the party closer to 10% support in 2019, similar to national trends.
For females, the year following the 2015 election, support of the Liberal party was largely stable sitting between 45% to almost 60% in some polls. This indicated a strong support base for the Liberals, especially since the Conservatives were polling between 20% – 30% percent among female voters for most of 2016 and 2017.
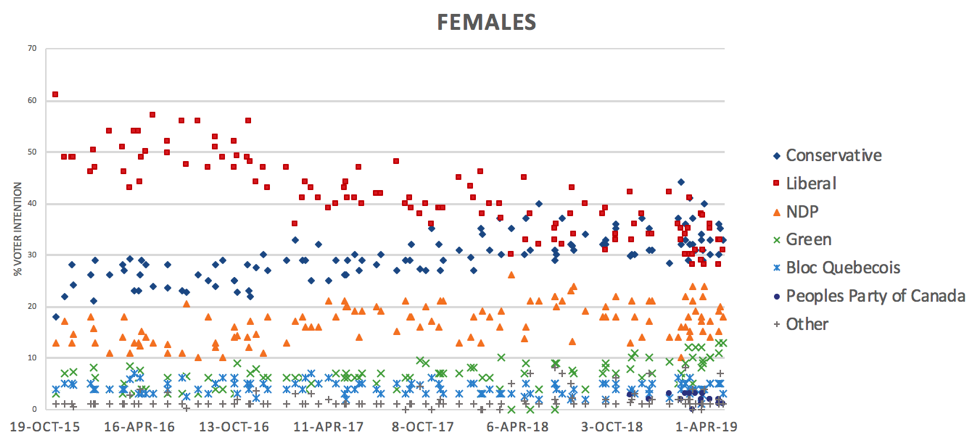
Similar to the male demographic, Liberal support began to significantly decline in late 2016 with a large drop to 40% – 45% in early 2017 that continued to decline. Around this time, the Conservatives saw a slight increase in support that had them at 25% – 30% support and continued to gradually grow up until early 2019 where the large gap in support between the two parties closed with the Conservatives at 30%- 40% and Liberals at slightly above 25% – 40%.
Unlike the male demographic, the Conservatives have not pulled ahead of the Liberals as support for both parties continues to overlap as we approach the 2019 election. A slight overlap between the two parties at 30% – 40% support began to occur around mid-2018 which was more than a year after the same trend was observed in males. This is likely because the gap between support for the Liberals and Conservatives after the election was significantly greater in females than it was among males.
Similar to males, female support of third parties (NDP, Green, BQ) remained relatively stable over the last few years apart from a slight growth of the Green Party that has reached almost 15% support in 2019. The Green Party is polling slightly higher among female voters than males.
Despite the slight differences in polling numbers, a similar trend that follows the national falling Liberal and rising Conservatives can be observed among each gender. The next blog will look at different age groups to see if this general trend can also be observed in different demographic breakdowns.