
From October 16 to 17, 2018, ThreeHundredThirtyEight.com conducted a survey to assess support for the candidates in the Waterloo Region Chair race. The results showed Karen Redman in the lead but a large number of voters undecided. Ultimately, Karen Redman was successful during the election held from October 22 to 23, 2018. This post looks back to assess how accurate the survey was at predicting the election results.
In the original reporting of the race, we reported a margin of error of +/-4.25%. For simplicity sake, when reporting a margin of error a single value is typically shared. However, the calculation for margin of error actually varies based on the observed proportion. Results close to 50% have higher margins of error than results close to 10%. Forum Research breaks down the rough margins in a handy table by sample size and observed proportions. For example, according to Forum Research’s table, with a sample size of 300, the margin of error can vary between 3.4% (at 10% or 90% proportion) and 5.7% (at a 50% proportion).
In this post, one margin of error per sample is reported calculated at the 95% level (i.e. the results are considered accurate 19 times out of 20). However, in the commentary assessing the accuracy of the results the margin of error for the individual proportions were calculated using an online calculator.
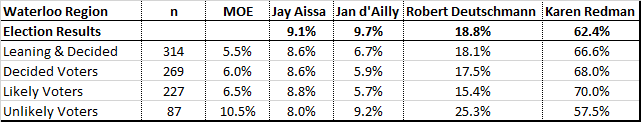
The obvious place to start is to assess the accuracy of the top line results as reported on October 18, 2018. Here we see that the results overall did quite well. The results of each candidate are within the margin of error except for Jan d’Ailly who slightly outperformed. His margin of error was 2.8 percentage points, yet he received 9.7% of the vote, a result 3.0 percentage points above his 6.7% predicted support. The tracking error on this model also performed quite well at 8.4 percentage points. The tracking error was calculated by taking the election results and subtracting them from the survey results, then adding the absolute value of each of these numbers.
The reported results included leaning and decided voters. It is also possible to compare only using decided voters. Once again in this approach, all results except for those involving Jan d’Ailly are within the margin of error. However, in this model, the tracking error increases to 11.2 percentage points.
A model was also created to predict likely voters. In this model, the results do not work as well. Both Karen Redman and Jan d’Ailly are outside of the margin of error in this model and the tracking error increases to 15.3 percentage points. Interestingly, using only unlikely voters all candidates results are within the margin of error. The small sample size for this group increases the margin of error. The tracking error amongst unlikely voters is 13.1 percentage points.
When the results of leaning and likely voters are broken down by city/township they all fall within the margin of error. However, it should be noted some of these sample sizes are very small creating very large margins of error. It is worth noting with respect to Karen Redman, the Cambridge results were at the edge of the Margin of Error at the 95% level.
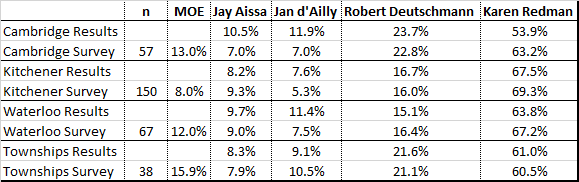
The tracking error was lowest in the townships at 2.7 percentage points, followed by Kitchener at 5.9 percentage points, then Waterloo at 9.3 percentage points, and then Cambridge at 18.5 percentage points.
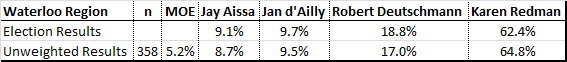
One final comparison was made. The results reported publically were weighted by age, gender, and city/township of residence. However, it is also possible to compare the unweighted survey results to the actual election results. This approach finds all of the results well within the margin of error and a tracking error of 4.8.
Overall the results of the survey were a fairly good predictor of the actual election results. Indeed, even the breakdown by city/township showed results that were a reasonable predictor of the actual election results. However, the likely voter model was a poor predictor of the election results. It is fortunate this model was not used. It is also interesting to note that weighting the variables did not improve the predictive power of the survey.