Menu Close

Part I. The pre-problem stage of acid rain

By Sarah Stickland

The relationship between policy and public opinion has been studied for decades. Some social scientists argue that the public opinion shapes policy. While others argue that policy shapes the publics opinion.  I believe that it is situational, but there is always a small minority pushing for policy change.  When it comes to environmental policy, this is the case of a minority making a continuous effort, and eventually succeeding.  The minority become a majority when the society feels threatened and believes they can make a change. Anthony Downs describes this an issue-attention cycle.  We can see this cycle in Canadian policy and public opinion towards acid rain between the 1960s and 1990s.

The issue attention is a five stage cycle that the public goes through when determining the priority of their interest. The stages are pre-problem, alarmed discovery and euphoric enthusiasm, realizing the cost of significant progress, gradual decline of intense public interest, and the post-problem stage. The pre-problem stage emerges when there are undesirable social conditions and the problem is typically at the worst point here. The second stage the public becomes aware and alarmed about the problem and wants to find a solution to the problem. However, the public then becomes discouraged or not interested in making scarifies to rectify to the problem. This leads to a gradual decline in the public’s interest in solving the problem or another problem enters stage two of the cycle and this problem is forgotten (Downs 2001, 39-41). 

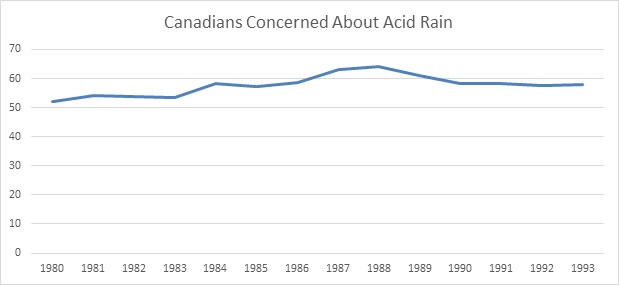
Figure 1: Canadian public opinion on acid rain (1980-1993)

Acid rain according to Environment and Climate Change Canada is, acid deposition caused by sulphur dioxide and nitrogen oxides that enter the atmosphere and become acidic when in contact with water. Acid rain affects water quality, air quality and is a part of climate change. 

The pre-problem stage was happening the in 1960s and 70s. The acidic levels the air and water were high. This was especially the case in Sudbury, Ontario because it had industries using sulphur in the production process. At the same time, there was a small minority that pressured the federal government to control pollution and ensure clean air and water. This is evident with public opinion polls conducted by Environics, Canadian Gallup Poll, and Decimal Quarterly between 1980 and 1990 asking Canadians their opinion towards acid rain (figure 1). 

The data illustrates that the public entered stage two of the issue attention cycle in the late 1980s. This makes it a case where the public adjusted its preference in reaction to policy changes (Soroka and Wlezien 2004, 532). We know this because industries and both Federal and Provincial governments were already starting to solve acid rain prior to the peak of the public’s concern. Part II will explain how the public entered into the second stage, the policies implemented, and what we learned from this case.

The Accuracy of the Dyad Ratio Algorithm and the 2015 Federal Election

The Dyad Ratio Algorithm, as explained in the previous post, can be used to estimate public opinion towards issues or support for political parties. This approach does not weight the polling firms on their accuracy or their potential bias instead all surveys are assumed to be equally valid, with the only variance in importance of a poll for the model based on the survey sample size. This is contrast to Éric Grenier’s approach at CBC and Nate Silver’s approach at fivethirtyeight.com.

Grenier at CBC weights the results by sample size, time of the poll, and firm accuracy. Polling firm accuracy is determined by the firm’s last survey before an election compared to the election result for each election polled over the past ten years. A survey’s impact diminishes by 35% for each day of an election. Silver at fivethirtyeight.com also uses accuracy of the polling firm and a measure for house effects which is built into the model itself. Silve’s approach also uses sample size to weight the impact.


ThreeHundredThirtyEight.com at this time does not have a record of the accuracy of polling firms, as such the approach used here accounts for each poll equally in the results. When examining the 2015 federal election the  model’s approach performed quite well at predicting party support.

Comparing the projections from the Dyad Ratio Algorithm using Wcalc to the election results each outcome is within 1.1 percentages points of the final results. (Note the election results were re-calculated to remove those who voted for an ‘other’ party). The Conservatives are projected exactly, Bloc within 0.2 percentage points, the NDP are within 0.5 percentage points, the Liberals within 0.8 percentage points and the Greens within 1.1 percentage points.

The results of the Dyad Ratio Algorithm also outperformed the projection from Éric Grenier narrowly. Grenier has the Conservatives within 1 percentage point, Bloc within 0.2 percentage points, the NDP are within 2 percentage points, the Liberals within 2.3 percentage points and the Greens within 1 percentage point. Though it is worth noting that Grenier’s projections were able to include ‘other’, which he projected to yield 0.9% support compared to the 0.8% they actually received. Also, in fairness, the Dyad Ratio Algorithm projections are being made after the fact and Grenier’s were made in real time before the election results were known. To put it another way, if these results had shown ThreeHundredThirtyEight.com to do significantly worse this model would have been re-examined.

The next step is to begin testing the model to predict support during elections. Future posts will use data from Wikipedia to show how the Dyad Ratio Algorithm is projecting support for the federal parties on an on-going basis.

Party Support in the 2015 Federal Election

As promised in my first post, this post uses the 2015 federal election to show how ThreeHundredThirtyEight.com will track support for political parties over time use the Dyad Ratio Algorithm as calculated using Wcalc by James Stimson.

Essentially this algorithm uses the differences between polls and their sample sizes to show the varying level of support for issues or parties over time. When the timing of polls overlap this gives the ratio an opportunity to evaluate how they compare to one another. The multiple polls that are inputted into the program then are combined to create a trend line show changes in support over time. One important note with this approach, for a result to appear in the calculation the polling firm needs to ask the question at least twice (and the more times the better).


Before demonstrating the approach a few other caveats should be covered. Wcalc offers a smoothing option, which is used in this analysis. The smoothing effect assumes that changes in opinion are generally gradual and that abrupt changes may be the result of sampling error. Smoothing has a particularly large impact at times when there are only a few polls and typically less of an impact when there are many polls in a given time period.

Secondly, since the Dyad Ratio Algorithm is used to estimate support for each political party individually the total support levels at any one point in time does not always add up to exactly 100%. When this occurs the data has been reweighted so the total support for each political party always equals 100%.

When the Dyad Ratio Algorithm estimates each party’s level of support during the 2015 federal election the results can be graphed to show the changes over time. The resulting graph shows the levels of support for the NDP fall dramatically starting in late September and the Liberal party rising mostly steady throughout the campaign.

The previous graph was created using data from the Wikipedia page Opinion polling in the Canadian federal election, 2015. This Wikipedia page also graphs the data thanks to the work of Galneweinhaw. The Wikipedia graph is created by using Local Regressions; they also add confidence intervals in grey at the 95% level.

Opinion Polling during the 2015 Canadian Federal Election

The noticeable difference between the approaches is the additional smoothing in the Wikipedia approach. Here the NDP trendline is much clearer in its direction from the start of the campaign to the end. While this is a valuable approach for avoiding the impact of outlier polls, the additional smoothing may be less likely to pick up a shift in support, instead assuming a high or low poll is simply an outlier.

Indeed, both approaches have value when interpreting an election. ThreeHundredThirtyEight.com will use the Dyad Ratio Algorithm to provide observers with more information about the election. In addition, the Dyad Ratio Algorithm is much more valuable when estimating changes in public opinion over time, as these changes are based on significantly less polling data.

In the next post how the Dyad Ratio Algorithm performed at predicting the final vote totals for each political party in the 2015 election will be explored. If you would like to work with this dataset yourself the raw data is available at http://doi.org/10.3886/E107121V1