
As promised in my first post, this post uses the 2015 federal election to show how ThreeHundredThirtyEight.com will track support for political parties over time use the Dyad Ratio Algorithm as calculated using Wcalc by James Stimson.
Essentially this algorithm uses the differences between polls and their sample sizes to show the varying level of support for issues or parties over time. When the timing of polls overlap this gives the ratio an opportunity to evaluate how they compare to one another. The multiple polls that are inputted into the program then are combined to create a trend line show changes in support over time. One important note with this approach, for a result to appear in the calculation the polling firm needs to ask the question at least twice (and the more times the better).
Before demonstrating the approach a few other caveats should be covered. Wcalc offers a smoothing option, which is used in this analysis. The smoothing effect assumes that changes in opinion are generally gradual and that abrupt changes may be the result of sampling error. Smoothing has a particularly large impact at times when there are only a few polls and typically less of an impact when there are many polls in a given time period.
Secondly, since the Dyad Ratio Algorithm is used to estimate support for each political party individually the total support levels at any one point in time does not always add up to exactly 100%. When this occurs the data has been reweighted so the total support for each political party always equals 100%.
When the Dyad Ratio Algorithm estimates each party’s level of support during the 2015 federal election the results can be graphed to show the changes over time. The resulting graph shows the levels of support for the NDP fall dramatically starting in late September and the Liberal party rising mostly steady throughout the campaign.
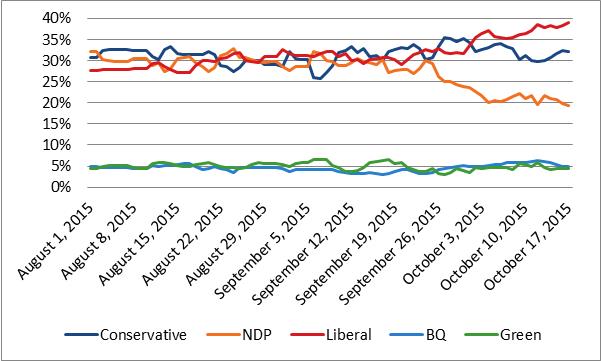
The previous graph was created using data from the Wikipedia page Opinion polling in the Canadian federal election, 2015. This Wikipedia page also graphs the data thanks to the work of Galneweinhaw. The Wikipedia graph is created by using Local Regressions; they also add confidence intervals in grey at the 95% level.

The noticeable difference between the approaches is the additional smoothing in the Wikipedia approach. Here the NDP trendline is much clearer in its direction from the start of the campaign to the end. While this is a valuable approach for avoiding the impact of outlier polls, the additional smoothing may be less likely to pick up a shift in support, instead assuming a high or low poll is simply an outlier.
Indeed, both approaches have value when interpreting an election. ThreeHundredThirtyEight.com will use the Dyad Ratio Algorithm to provide observers with more information about the election. In addition, the Dyad Ratio Algorithm is much more valuable when estimating changes in public opinion over time, as these changes are based on significantly less polling data.
In the next post how the Dyad Ratio Algorithm performed at predicting the final vote totals for each political party in the 2015 election will be explored. If you would like to work with this dataset yourself the raw data is available at http://doi.org/10.3886/E107121V1