
By Natalie Pikulski
The original plan for ThreeHundredThirtyEight.com was to use Wcalc, a program developed by James Stimson to model changes in public support for provincial and federal parties in Canada. Wcalc uses the Dyad Ratio algorithm which is explained in greater detail in a previous ThreeHundredThirtyEight.com post. The Wcalc program worked very well for a trial run on the 2015 Federal Election but unfortunately more recent attempts to use the program have shown flaws in this approach. It appears the local regression approach (as used by Wikipedia), is a more effective method to track opinion changes related to elections, whereas Wcalc may be better suited to tracking policy mood. This blog post examines what went wrong when using Wcalc to track Canadian public opinion since the 2015 federal election and the following post examine the problems associated with using Wcalc to predict the 2018 Ontario provincial election.
We began this analysis by collecting all usable individual Canadian federal polling data from November 7, 2015 to May 4, 2019 that were reported by CBC Poll Tracker and Wikipedia. Usable data was based on working links to reports that are available online as of May 2019 and polling questions that are consistent or similar to questions asked by other polling organizations. Voter intention percentages and sample sizes were based on all leaning and decided responses in each poll.
In an Excel spreadsheet, we tracked support for six party categories (Liberal, Conservative, NDP, Bloc Quebecois, Green, and Other) with the PPC added in 2018. However, there were notable issues that created some problems in our tracking:
- Mainstreet did not have an “other party” category until 2018 which resulted in 2 years’ worth of polls that were not able to be entered in the “other category” when using the Wcalc program as blank values are not accepted. 2018 onward, the organization included an “other party” category and eventually included a “People’s Party of Canada” option since the party emerged, allowing us to use all the data from this time forward.
- Abacus Data conducted rolling polls in 2019 however the reports from March 4 to March 10 did not include detailed breakdown tables that we could pull “other numbers from”. The reports only provided graphs that indicated overall numbers for each main party’s support but did not feature a graph line for the “other category”. We needed to remove these polls before running the “other category” through Wcalc.
- Ipsos did not consider the Green party a separate category for any of its polls despite the Party polling at similar levels to the BQ, which was included by Ipsos. All the Green Party support was likely placed in the other category which inflated the category significantly when compared to other polling organizations that had Green as a separate category. These high “other” polls and blank Green polls needed to be removed before running the data through the Wcalc program. Ipsos only had one poll which included the Green Party and the PPC as a separate category, but this poll was not usable for our purposes as the Wcalc program requires at least 2 similar data sets to compare results.
- All Nanos Research polls were entirely removed for our purposes since the question asked had respondents rank their top two choices for voting intention rather than one choice like all other organizations. The difference in questions was not consistent with other polls and therefore not usable for the Wcalc program.
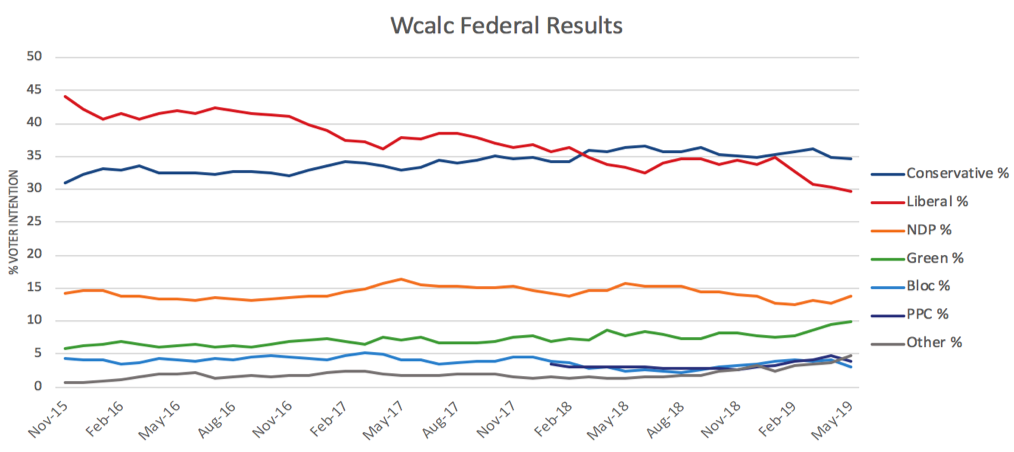
After running the individual polling data through the Wcalc program, the results showed some close similarities to other polling trackers for the Liberal, Conservative, and Green parties and a slightly larger gap between the NDP and Bloc but still within decent range. The main issue encountered with the program was the significantly higher score of the PPC and “Other Party” categories that scored much higher in Wcalc when compared to other polling averages. The average below are as of early May 2019.
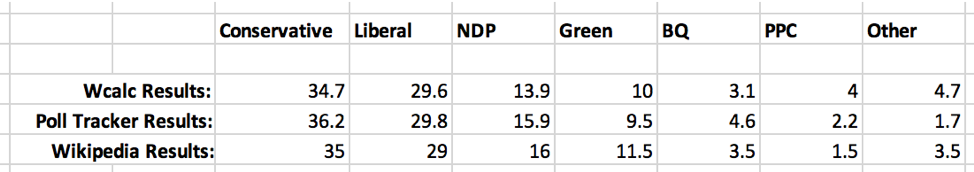
The Wikipedia poll tracker uses a Loess regression method to calculate the public opinion poll averages over time. While most parties had similar results when compared to our Wcalc calculations, the results for the PPC were much higher in Wcalc while the NDP was lower. It should be noted that both Wikipedia and CBC poll trackers included the Nanos polls that we had removed due to their inconsistency with other polls. This may be a contributor to the differences, along with the limitations of Wcalc.
Overall, Wcalc remains better suited for long-term tracking of public opinion polls that are not as susceptible to sudden changes like political/election polling are. The smoothing effect in this program assumes sudden changes are likely due to sampling errors which is less effective for polls that may change drastically in a short amount of time. The gaps in our results compared to others indicate this program may not be as reliable as others for our purposes. These gaps are even more pronounced when examining data during the 2018 Ontario election, which will be analyzed in our next blog post.