By: Shane Calderwood
The 2019 Canadian election is over, and the electoral map suggests Canadians are more divided than ever before. Western Canada voted overwhelmingly for Conservatives taking the entire provinces of Alberta and Saskatchewan, and Canadians also witnessed the resurrection of the Bloc Quebecois. Meanwhile, the Liberals won riding throughout Newfoundland and Labrador, Yukon and the Northwest Territories. Arguments arising from the election results include the lack of voter representation in Ottawa, the misrepresentation of the popular vote, and the rise of strategic voting. While Western Canada is giving rise to the conversation of a “Wexit” and Quebec sovereignty is mainstream political Canadian discourse again. All these trends underscore that the time for electoral reform is now, and Mixed Member Proportional Representation (MMP) is the optimal choice for Canada. MMP solves the issues related to voter participation, voter representation, and strategic voting.
Political Issues and Why It Matters
Voter participation is always an issue in the federal election, and the 2019 voter participation results were only 66% which is a drop from 68% in 2015. Various theories give way to why people don’t vote such as lack of trust in government and so on, but one of the major reasons is the idea that “my vote doesn’t matter.” This goes to the debate that the current system discourages voter participation.
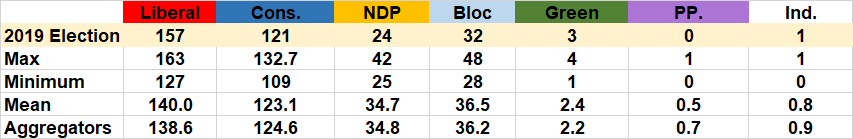
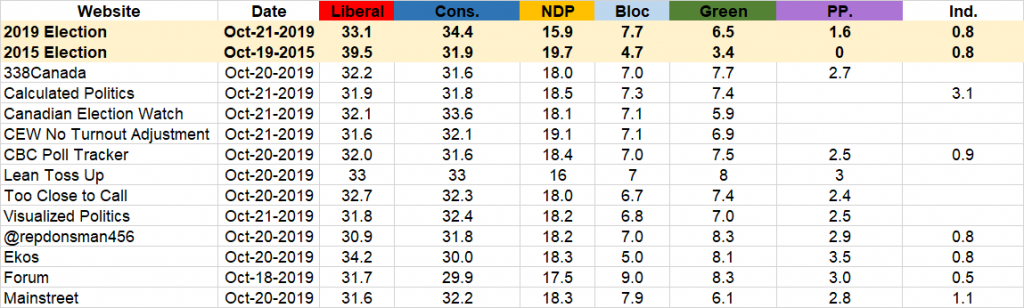
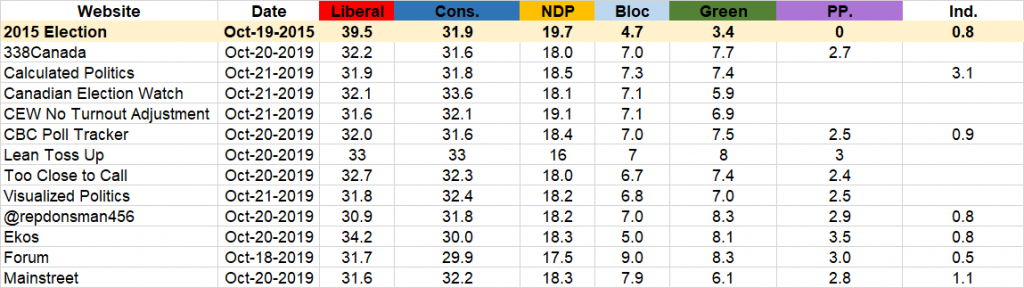
Secondly, there is an argument for considering the popular vote results as a true reflection of what voters want and using the popular vote as means to form government could encourage greater voter participation as it would mean, “all votes do matter.” The results of the popular vote include Conservatives at 34%, the Liberals at 33%, the Bloc at 8%, NDP at 16% and the Green Party at 7% which is reflective of the minority government as no party could capture 50% of the popular vote, but alternatively, the distribution of seats in the House of Commons unfairly represents these results and in turn, fails to reward voter participation.
Lastly, the idea and argument of strategic voting, some voters are more inclined to vote for a party they think will keep another party from winning versus voting for the party they support which enables a two-party system in Canada. I can remember walking into the voting centre as a strong supporter of climate change, but when I cast my vote for the Green Party, I was thinking I should throw this in the garbage versus the ballot box as I knew my preferred choice has zero chance of winning my riding let alone the election. Thus, my ballot was worth as much as the piece of paper I used to cast it. There is a position that single plurality has been a means of compromise in Canada’s electoral system, and what has worked for years should not be changed. I argue a country as progressive as Canada ought to have an electoral system that is reflective of its core values which include diversity and inclusion.
From First Past the Post to Mixed Membered Proportional Representation The First Past the Post electoral system has been the preferred option since the conception of Canada. MMP could be used as tool to unite the country as it ensures all parties gain fair representation in the House of Commons and it forces them to work together to pass legislation whereby mediating the rising nature of divisive political discourse during a time where populism divide and the tyranny of majority erodes democracies.
Call to Action
In 2015, the Liberal Government made a platform promise to address electoral reform but would later walk back this promise suggesting there was a lack of consensus on the direction or available options. However, according to recent numbers released by the Angus Reid Poll (2019) over 68% of Canadians favour electoral reform, and another poll suggests 77% favour proportional representation. These stats are very reflective of the percentage of voter participation in the election as well which goes to the argument that the current federal government of Canada has a clear mandate to implement MMP as the optimal electoral reform option.